Example Usage
Here is a demonstartion of the potential usage of GOBLIN lite.
Imports
Firstly, we start of by importing the relevant classes.
import os
from IPython.display import Image

from goblin_lite.goblin import ScenarioRunner
from goblin_lite.resource_manager.goblin_data_manager import GoblinDataManager
from goblin_lite.scenario_analysis.data_grapher import DataGrapher
from goblin_lite.resource_manager.data_fetcher import DataFetcher
import shutil
import os


import warnings

# Filter out the RuntimeWarning related to unsupported linux distribution
warnings.filterwarnings("ignore", message="untested linux distribution:", category=RuntimeWarning)
The ScenarioRunner class is basically used to set to run the scenarios based on the configuration files for goblin and the CBM CFS3.
The DataFetcher class is used to retrieve the various results as dataframes from the scenario run. Each of the methods in the DataFetcher class relates to specific table.
The DataGrapher class is still being developed, but contains some basic plotting to assist the user in visualising the results tables.
The Scenario Runner
In the first example below, we will set the path to the configurations, define the emissions factor country and the base and target year. Finally, we will create a directory for our outputs
#configuration

goblin_config = "../tests/data/config.json" #location of test goblin configuration

cbm_config = "../tests/data/cbm_factory.yaml" #location of test cbm configuration

ef_country = "ireland" #emissions factor country

#years for the baseline, and the target year
baseline_year = 2020
target_year = 2050

#Make directory to store exported file

os.mkdir("jupyter_example")

data_path = "./jupyter_example/"
Define classes and Run Scenarios
# create goblin data manager
goblin_data_manger = GoblinDataManager(
    ef_country = ef_country,
    calibration_year= baseline_year,
    target_year= target_year,
    configuration_path= goblin_config,
    cbm_configuration_path= cbm_config,
)

# class instances
runner_class = ScenarioRunner(goblin_data_manger)
graph_class = DataGrapher()
fetcher_class = DataFetcher()
#Run Scenarios
runner_class.run_scenarios()
Existing tables have been deleted.
JSON file detected
Land use Assignment Solution is optimal!
Land use Assignment Solution is optimal!
Land use Assignment Solution is optimal!
Land use Assignment Solution is optimal!
Land use Assignment Solution is optimal!
Land use Assignment Solution is optimal!
Land use Assignment Solution is optimal!
Land use Assignment Solution is optimal!
Land use Assignment Solution is optimal!
Land use Assignment Solution is optimal!
Land use Assignment Solution is optimal!
Land use Assignment Solution is optimal!
🚀 Starting FM Simulation...
✅ FM Simulation Complete.
Cleaning scenario SIT data directories
No eligible stands found for DISTID2 in Year 1
No eligible stands found for DISTID1 in Year 1
No eligible stands found for DISTID2 in Year 2
No eligible stands found for DISTID1 in Year 2
No eligible stands found for DISTID2 in Year 3
No eligible stands found for DISTID1 in Year 3
No eligible stands found for DISTID2 in Year 4
No eligible stands found for DISTID1 in Year 4
No eligible stands found for DISTID2 in Year 5
No eligible stands found for DISTID1 in Year 5
No eligible stands found for DISTID2 in Year 6
No eligible stands found for DISTID1 in Year 6
No eligible stands found for DISTID2 in Year 7
No eligible stands found for DISTID1 in Year 7
No eligible stands found for DISTID2 in Year 8
No eligible stands found for DISTID1 in Year 8
No eligible stands found for DISTID2 in Year 9
No eligible stands found for DISTID1 in Year 9
No eligible stands found for DISTID1 in Year 10
No eligible stands found for DISTID1 in Year 11
No eligible stands found for DISTID1 in Year 12
No eligible stands found for DISTID1 in Year 13
No eligible stands found for DISTID1 in Year 14
No eligible stands found for DISTID1 in Year 15
No eligible stands found for DISTID1 in Year 16
No eligible stands found for DISTID1 in Year 17
No eligible stands found for DISTID1 in Year 18
No eligible stands found for DISTID1 in Year 19
No eligible stands found for DISTID1 in Year 20
No eligible stands found for DISTID1 in Year 21
No eligible stands found for DISTID1 in Year 22
No eligible stands found for DISTID1 in Year 23
No eligible stands found for DISTID1 in Year 24
No eligible stands found for DISTID1 in Year 25
No eligible stands found for DISTID1 in Year 26
/home/colmduff/Dropbox/projects/FORESIGHT/packages/goblin_lite/.venv/lib/python3.10/site-packages/goblin_cbm_runner/cbm/data_processing/default_processing/SC_disturbances.py:145: UserWarning: Adjusted area for species 'Sitka' and yield class 'YC17_20' is 0 after adjustment.
  warnings.warn(f"Adjusted area for species '{species}' and yield class '{yield_class}' is 0 after adjustment.")
/home/colmduff/Dropbox/projects/FORESIGHT/packages/goblin_lite/.venv/lib/python3.10/site-packages/goblin_cbm_runner/cbm/data_processing/default_processing/SC_disturbances.py:145: UserWarning: Adjusted area for species 'Sitka' and yield class 'YC20_24' is 0 after adjustment.
  warnings.warn(f"Adjusted area for species '{species}' and yield class '{yield_class}' is 0 after adjustment.")
/home/colmduff/Dropbox/projects/FORESIGHT/packages/goblin_lite/.venv/lib/python3.10/site-packages/goblin_cbm_runner/cbm/data_processing/default_processing/SC_disturbances.py:145: UserWarning: Adjusted area for species 'Sitka' and yield class 'YC24_30' is 0 after adjustment.
  warnings.warn(f"Adjusted area for species '{species}' and yield class '{yield_class}' is 0 after adjustment.")
/home/colmduff/Dropbox/projects/FORESIGHT/packages/goblin_lite/.venv/lib/python3.10/site-packages/goblin_cbm_runner/cbm/data_processing/default_processing/SC_disturbances.py:145: UserWarning: Adjusted area for species 'SGB' and yield class 'YC6' is 0 after adjustment.
  warnings.warn(f"Adjusted area for species '{species}' and yield class '{yield_class}' is 0 after adjustment.")
/home/colmduff/Dropbox/projects/FORESIGHT/packages/goblin_lite/.venv/lib/python3.10/site-packages/goblin_cbm_runner/cbm/data_processing/default_processing/SC_disturbances.py:154: UserWarning: FOR SCENARIO 3: Total adjustment applied 0.0 does not match the intended area adjustment 6000.
  warnings.warn(f"FOR SCENARIO {scenario}: Total adjustment applied {total_adjustment_applied} does not match the intended area adjustment {area_adjustment}.")
No eligible stands found for DISTID2 in Year 1
No eligible stands found for DISTID1 in Year 1
No eligible stands found for DISTID2 in Year 2
No eligible stands found for DISTID1 in Year 2
No eligible stands found for DISTID2 in Year 3
No eligible stands found for DISTID1 in Year 3
No eligible stands found for DISTID2 in Year 4
No eligible stands found for DISTID1 in Year 4
No eligible stands found for DISTID2 in Year 5
No eligible stands found for DISTID1 in Year 5
No eligible stands found for DISTID2 in Year 6
No eligible stands found for DISTID1 in Year 6
No eligible stands found for DISTID2 in Year 7
No eligible stands found for DISTID1 in Year 7
No eligible stands found for DISTID2 in Year 8
No eligible stands found for DISTID1 in Year 8
No eligible stands found for DISTID2 in Year 9
No eligible stands found for DISTID1 in Year 9
No eligible stands found for DISTID1 in Year 10
No eligible stands found for DISTID1 in Year 11
No eligible stands found for DISTID1 in Year 12
No eligible stands found for DISTID1 in Year 13
No eligible stands found for DISTID1 in Year 14
No eligible stands found for DISTID1 in Year 15
No eligible stands found for DISTID1 in Year 16
No eligible stands found for DISTID1 in Year 17
No eligible stands found for DISTID1 in Year 18
No eligible stands found for DISTID1 in Year 19
No eligible stands found for DISTID1 in Year 20
No eligible stands found for DISTID1 in Year 21
No eligible stands found for DISTID1 in Year 22
No eligible stands found for DISTID1 in Year 23
No eligible stands found for DISTID1 in Year 24
No eligible stands found for DISTID1 in Year 25
No eligible stands found for DISTID1 in Year 26
No eligible stands found for DISTID2 in Year 33
No eligible stands found for DISTID2 in Year 34
No eligible stands found for DISTID2 in Year 35
No eligible stands found for DISTID2 in Year 36
🚀 Starting AF Simulation...
✅ AF Simulation Complete.
🚀 Starting Scenario 0 Simulation...
✅ Scenario 0 Simulation Complete.
🚀 Starting Scenario 1 Simulation...
✅ Scenario 1 Simulation Complete.
🚀 Starting Scenario 2 Simulation...
✅ Scenario 2 Simulation Complete.
🚀 Starting Scenario 3 Simulation...
✅ Scenario 3 Simulation Complete.
Running Forest Flux scenario -1
Running Forest Flux scenario 0
🚀 Starting Scenario 0 Simulation...
✅ Scenario 0 Simulation Complete.
Running Forest Flux scenario 1
🚀 Starting Scenario 1 Simulation...
✅ Scenario 1 Simulation Complete.
Running Forest Flux scenario 2
🚀 Starting Scenario 2 Simulation...
✅ Scenario 2 Simulation Complete.
Running Forest Flux scenario 3
🚀 Starting Scenario 3 Simulation...
✅ Scenario 3 Simulation Complete.
Scenario Generation Complete ...
If the calibration year is not present for a specific dataset, the default year of 2015 is used.
The Data Fetcher
The Scenario Run is now complete, and we can use the DataFectcher class to retrieve our data.
Note: Once a scenario run is complete, when the user again runs scenarios, table output from the previous run is completely deleted.
Here we will retrieve data for:
- Livestock outputs
- Aggregated emissions
- Animal emissions by category
- Land use emissions by category
- Crop emissions by category
- Forest carbon flux
These are not the only potential returns, as there are several additional methods returning results out. Please consult the documentation for further details.
#Livestock outputs

animal_output_df = fetcher_class.get_livestock_output_summary()

print(animal_output_df)

# baseline is index -1
           total_milk_kg  total_beef_kg
Scenarios
-1          8.251443e+09   6.528033e+08
 0          5.339220e+09   2.596987e+08
 1          5.339220e+09   2.596987e+08
 2          5.339220e+08   2.867735e+07
 3          5.339220e+08   2.867735e+07
#Aggregated emissions
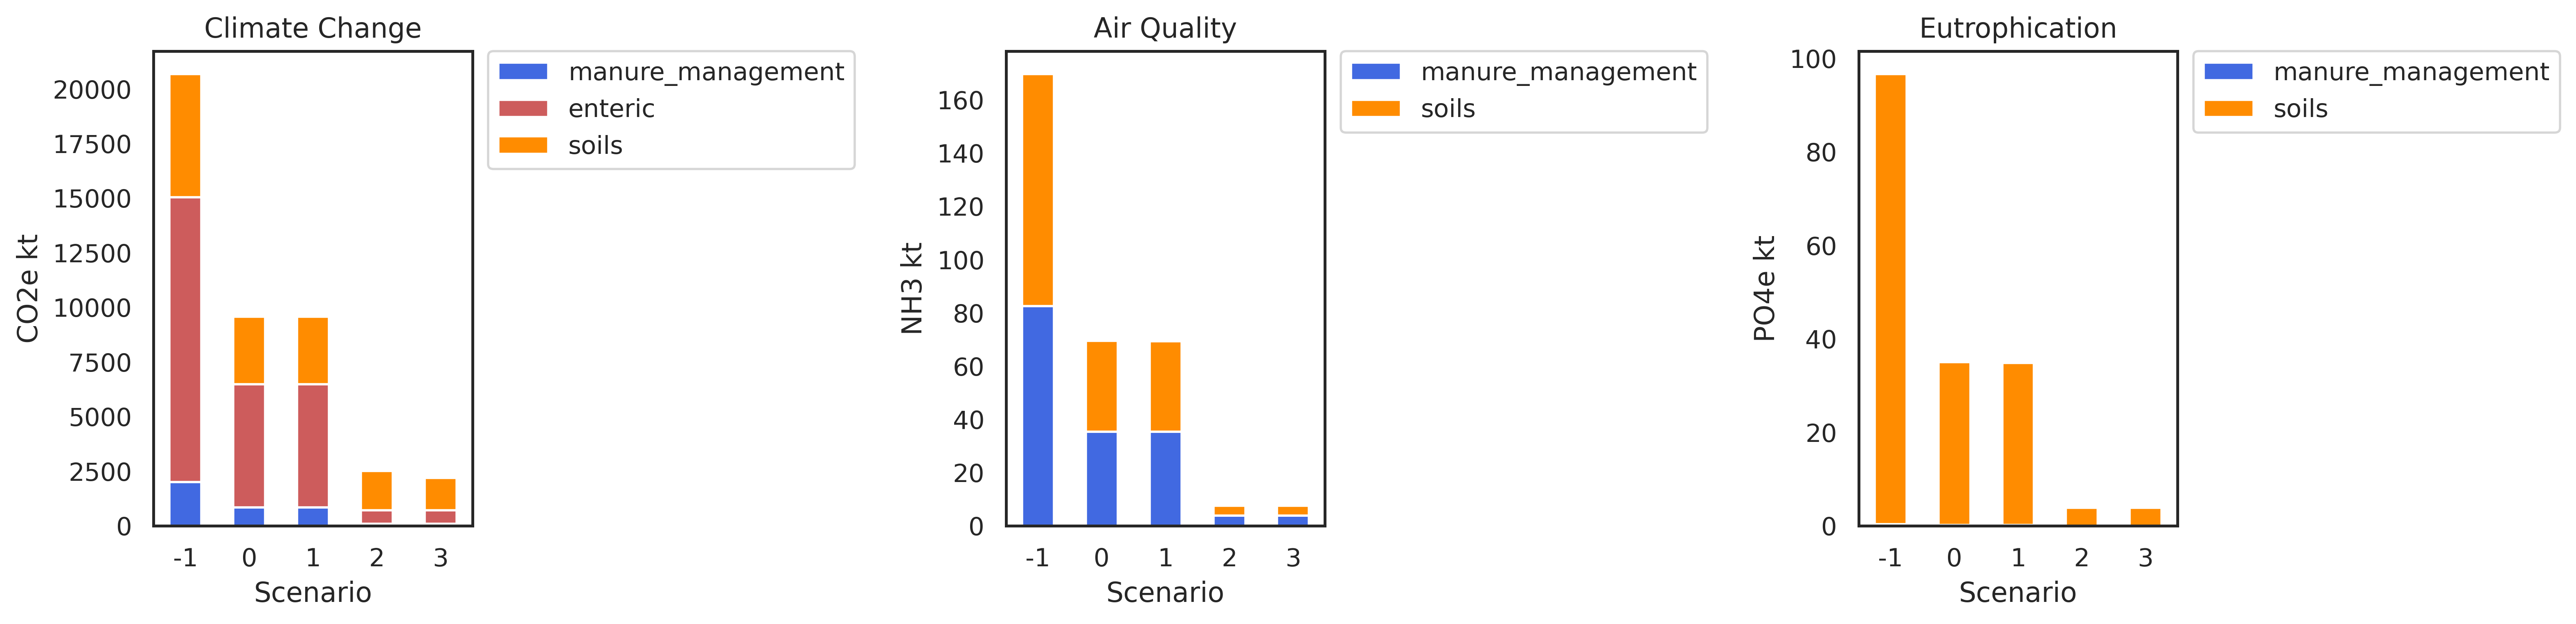
aggregated_emmissions_df = fetcher_class.get_climate_change_emission_totals()
print(aggregated_emmissions_df)
# baseline is index -1
              CH4        N2O           CO2          CO2e
index
-1     634.471263  23.086912   1597.660312  25480.887284
 0     345.156857  11.978671 -42419.597283 -29580.857430
 1     345.254639  11.960627 -42555.037282 -29718.341292
 2     150.043936   6.082288 -59365.973151 -53552.936750
 3     163.716836   4.877576   5099.580183  10976.209297
#Animal emissions by category

animal_emissions_df = fetcher_class.get_climate_change_animal_emissions_by_category()

print(animal_emissions_df)

# baseline is index -1
       enteric_ch4  manure_management_N2O  manure_management_CH4  \
index
-1      465.584094               3.075505              42.622576
 0      201.478299               1.314963              17.416696
 1      201.562043               1.315096              17.430742
 2       21.863310               0.142774               1.919709
 3       21.863310               0.142774               1.919709

       manure_applied_N  N_direct_PRP  N_indirect_PRP  N_direct_fertiliser  \
index
-1             0.920240      4.628077        0.765050             7.109264
 0             0.396043      2.014180        0.334145             2.169335
 1             0.396043      2.015091        0.334278             2.153109
 2             0.042917      0.218468        0.036202             0.246916
 3             0.042917      0.218468        0.036202             0.246916

       N_indirect_fertiliser   soils_CO2  soil_organic_N_direct  \
index
-1                  1.239013  508.885373               5.548316
 0                  0.400493  437.103111               2.410223
 1                  0.397497  436.821734               2.411134
 2                  0.045585  403.764999               0.261384
 3                  0.045585  403.764999               0.261384

       soil_organic_N_indirect  soil_inorganic_N_direct  \
index
-1                    0.765050                 7.109264
 0                    0.334145                 2.169335
 1                    0.334278                 2.153109
 2                    0.036202                 0.246916
 3                    0.036202                 0.246916

       soil_inorganic_N_indirect  soil_histosol_N_direct  crop_residue_direct  \
index
-1                      1.239013                1.203983             3.529468
 0                      0.400493                1.203983             3.529468
 1                      0.397497                1.203983             3.529468
 2                      0.045585                1.203983             3.529468
 3                      0.045585                0.000000             3.529468

       soil_N_direct  soil_N_indirect  soils_N2O
index
-1         17.391033         2.004063  19.395095
 0          9.313009         0.734637  10.047647
 1          9.297695         0.731775  10.029470
 2          5.241752         0.081786   5.323538
 3          4.037769         0.081786   4.119555
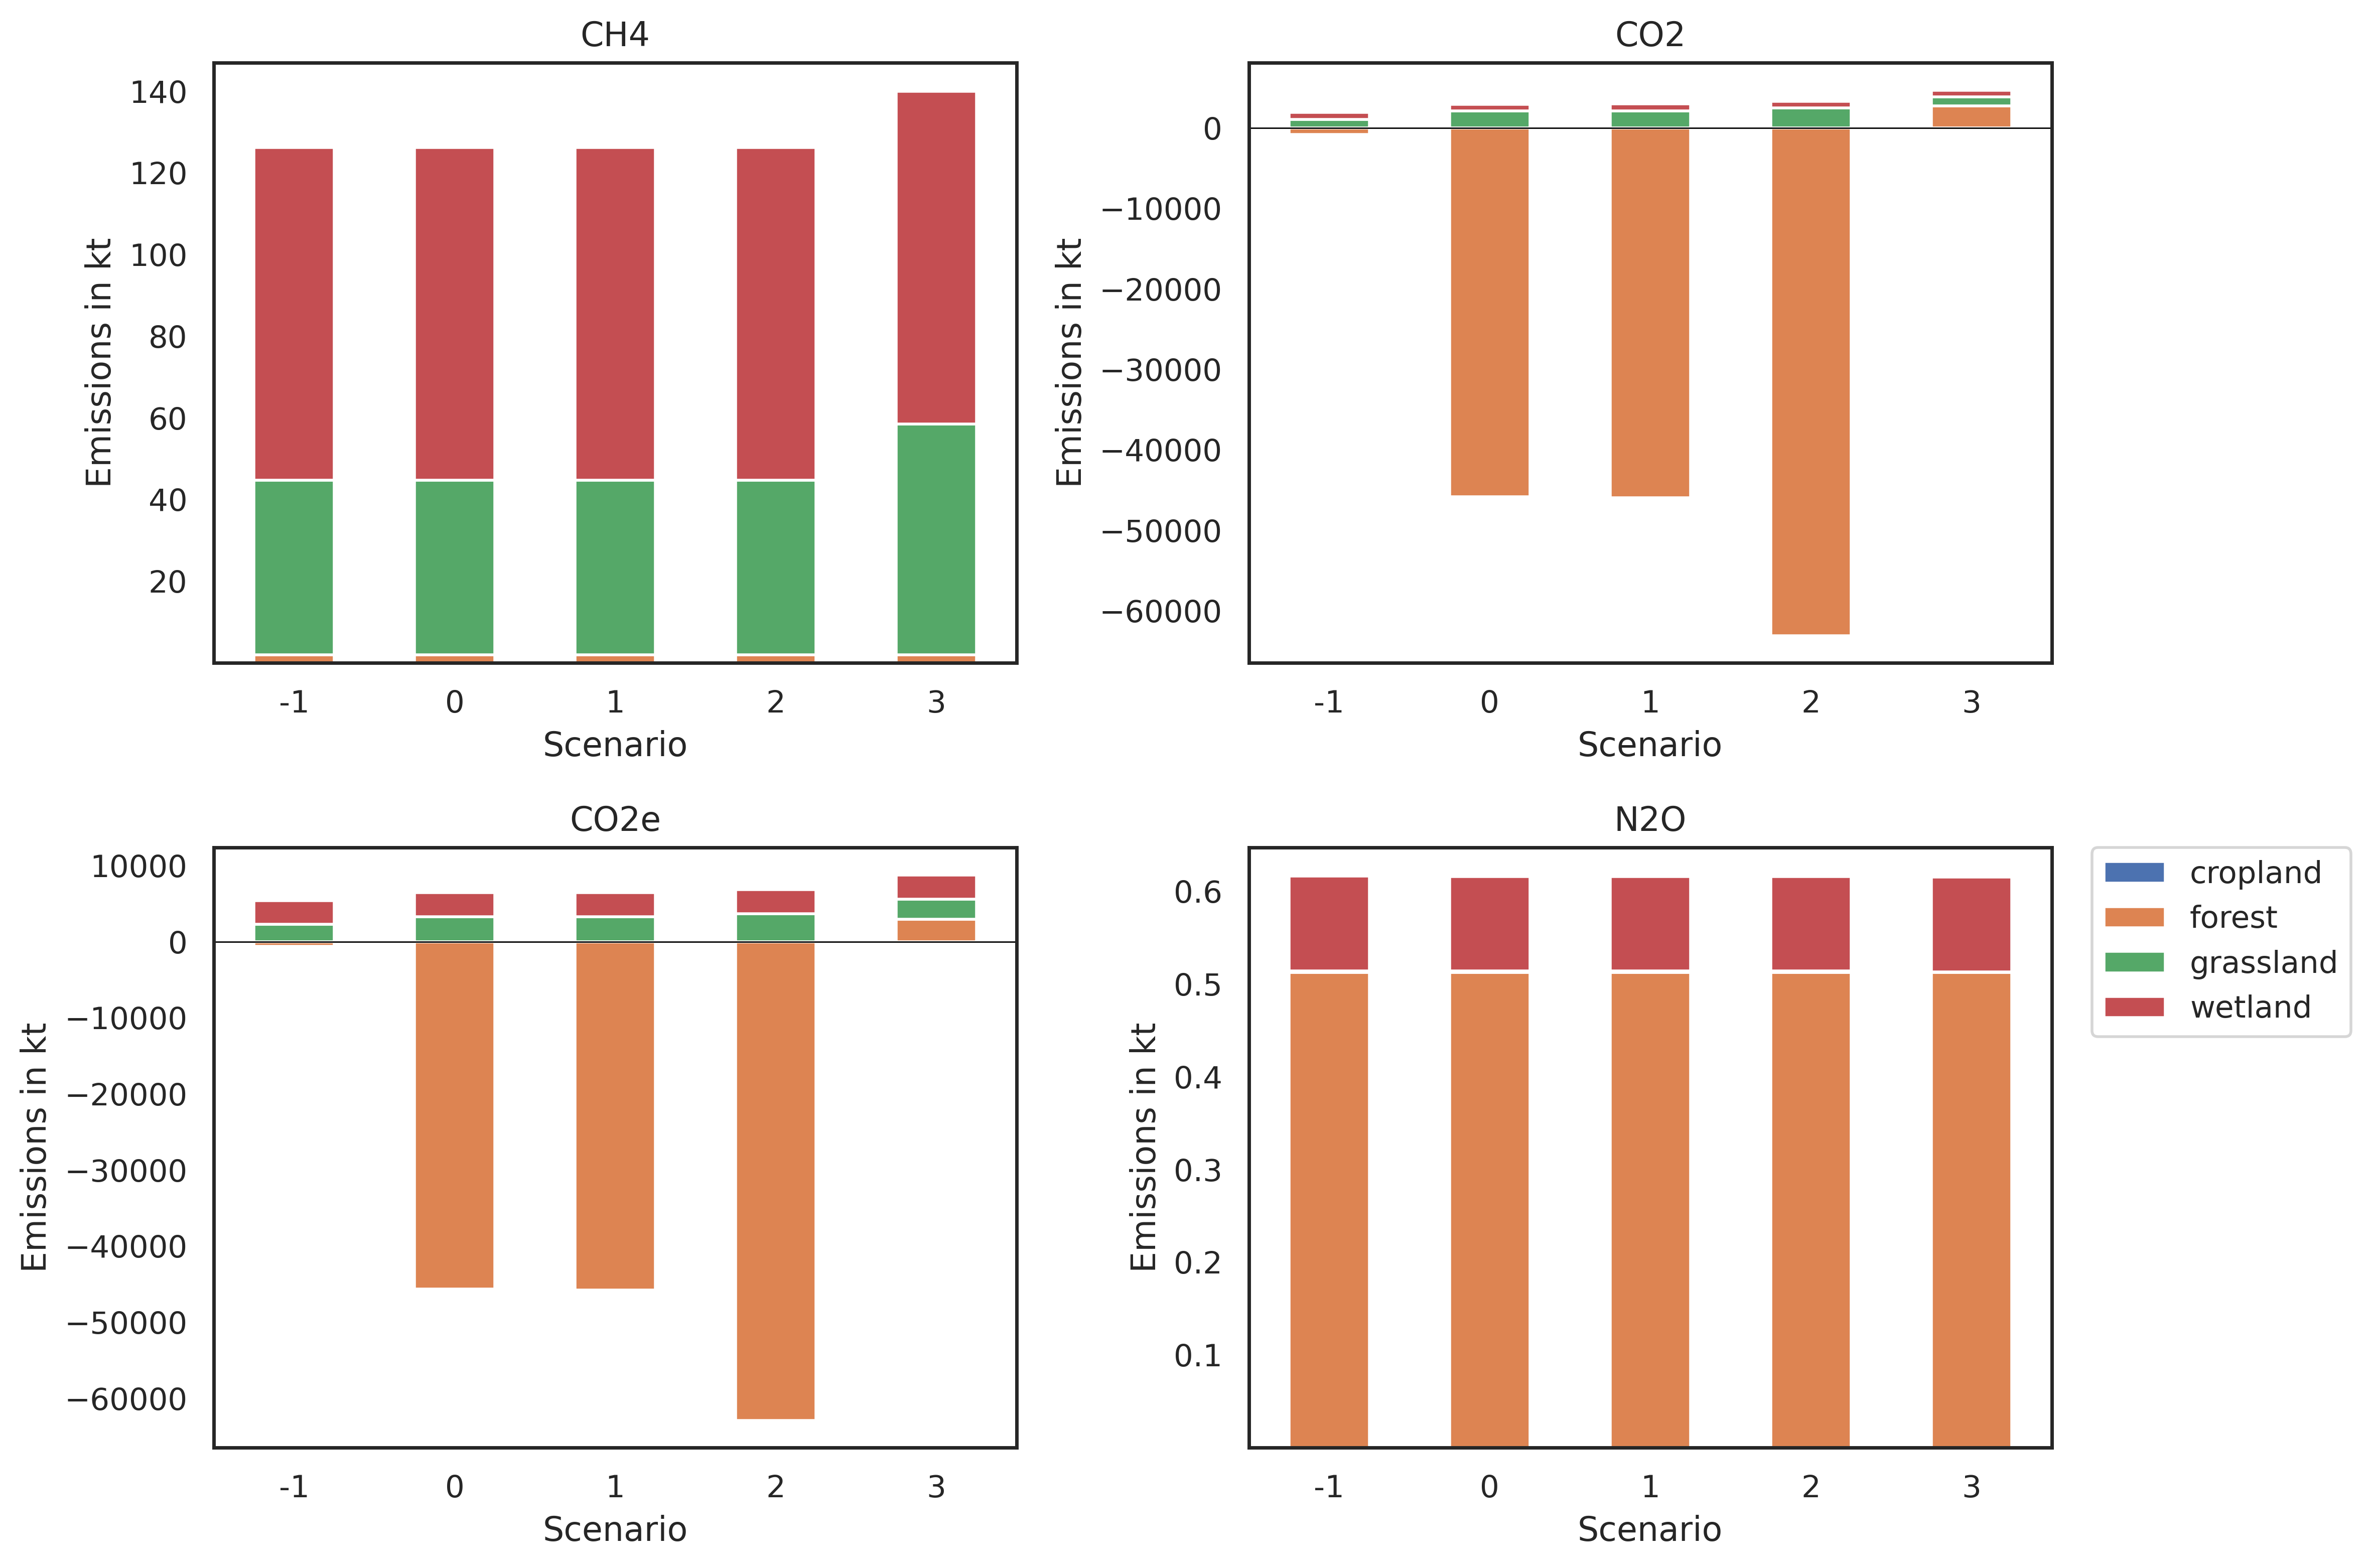
#Land use emissions by category

land_emissions_df = fetcher_class.get_landuse_emissions_totals()

print(land_emissions_df)

# baseline is index -1
           land_use  year           CO2         CH4       N2O          CO2e
scenario
-1         cropland  2020      0.000000    0.000154  0.000004      0.005380
-1        grassland  2020   1061.271545   42.841175  0.001507   2261.223915
-1           forest  2020   -826.301767    1.926434  0.512809   -636.467356
-1          wetland  2020    853.805160   81.496830  0.101991   3162.744029
-1            total  2020   1088.774939  126.264594  0.616311   4787.505968
 0         cropland  2050      0.000000    0.000154  0.000004      0.005380
 0        grassland  2050   2104.978992   42.838444  0.001258   3304.788820
 0           forest  2050 -45815.484546    1.926434  0.512809 -45625.650135
 0          wetland  2050    853.805160   81.496830  0.101991   3162.744029
 0            total  2050 -42856.700393  126.261863  0.616062 -39158.111906
 1         cropland  2050      0.000000    0.000154  0.000004      0.005380
 1        grassland  2050   2108.032382   42.838436  0.001257   3307.841793
 1           forest  2050 -45953.696558    1.926434  0.512809 -45763.862147
 1          wetland  2050    853.805160   81.496830  0.101991   3162.744029
 1            total  2050 -42991.859016  126.261855  0.616061 -39293.270946
 2         cropland  2050      0.000000    0.000154  0.000004      0.005380
 2        grassland  2050   2466.750641   42.837497  0.001172   3666.511060
 2           forest  2050 -63090.293951    1.926434  0.512809 -62900.459540
 2          wetland  2050    853.805160   81.496830  0.101991   3162.744029
 2            total  2050 -59769.738150  126.260916  0.615975 -56071.199071
 3         cropland  2050      0.000000    0.000154  0.000004      0.005380
 3        grassland  2050   1100.700955   56.510398  0.000444   2683.109690
 3           forest  2050   2741.309068    1.926434  0.512809   2931.143479
 3          wetland  2050    853.805160   81.496830  0.101991   3162.744029
 3            total  2050   4695.815184  139.933817  0.615247   8777.002577
# Crop emissions by category

crop_emissions_df= fetcher_class.get_climate_change_crop_emissions_by_category()

print(crop_emissions_df)

# baseline is index -1
       crop_residue_direct  N_direct_fertiliser  N_indirect_fertiliser  \
index
-1                3.529468             0.491902               0.090813
 0                3.529468             0.491902               0.090813
 1                3.529468             0.491902               0.090813
 2                3.529468             0.491902               0.090813
 3                3.529468             0.491902               0.090813

       soils_CO2  soils_N2O
index
-1      6.166289   4.112183
 0      6.166289   4.112183
 1      6.166289   4.112183
 2      6.166289   4.112183
 3      6.166289   4.112183
#Forest carbon flux

forest_flux_df = fetcher_class.get_forest_flux()

print(forest_flux_df)

# baseline is index -1
       Year  Scenario           AGB            BGB       Deadwood  \
index
0      2016        -1 -1.483167e+06 -292623.377894  450706.684939
1      2017        -1 -1.329146e+06 -259552.888450  390128.918183
2      2018        -1 -1.165888e+06 -231130.326643  340176.462016
3      2019        -1 -1.023885e+06 -193607.219187  284864.486511
4      2020        -1 -6.726993e+05 -119159.178839  224499.288330
...     ...       ...           ...            ...            ...
399    2095         3  4.901180e+05   89949.303922   85245.890580
400    2096         3  7.148366e+05  139877.639149   55759.615771
401    2097         3  5.702518e+05  108988.138568   80799.793765
402    2098         3  3.918862e+05   77297.387112   98189.199641
403    2099         3  9.966661e+04    2682.274740  147647.468417

              Litter          Soil       Harvest  Total Ecosystem
index
0      360862.688404 -19354.592411 -6.111390e+05    -9.835760e+05
1      207662.538899 -22846.299798 -7.172140e+05    -1.013754e+06
2       60605.361161 -25956.277505 -8.012059e+05    -1.022192e+06
3        7386.388437 -26552.562870 -9.276150e+05    -9.517938e+05
4     -124837.441652 -28757.059873 -1.159521e+06    -7.209537e+05
...              ...           ...           ...              ...
399     19322.923837  -4450.889527 -1.294814e+06     6.801852e+05
400    -14785.382408  -3440.998235 -1.444073e+06     8.922475e+05
401     63632.838246  -1023.372511 -1.346598e+06     8.226492e+05
402    100723.434618    189.564358 -1.224614e+06     6.682858e+05
403    174258.884484   1010.008227 -1.043631e+06     4.252652e+05

[404 rows x 9 columns]
These are simple examples, additional information on inputs and outputs can be retrieved. Furhter impact categories related to eutrophication and air quality are also available.
DataGrapher
The data grapher allows the user to plot some of the data from the generated tables
#save image
graph_class.plot_animal_lca_emissions_by_category(data_path)

#retrieve an display
image_path = os.path.join(data_path,"Livestock_LCA.png")

# display the image
Image(filename=image_path)
#Land use emissions

graph_class.plot_land_use_emissions(data_path)

#retrieve an display
image_path = os.path.join(data_path,"climate_change_land_use.png")

# display the image
Image(filename=image_path)
# Remove Generated files

for filename in os.listdir(data_path):
    file_path = os.path.join(data_path, filename)
    try:
        if os.path.isfile(file_path):
            os.remove(file_path)
            print(f"Deleted file: {file_path}")
    except Exception as e:
        print(f"Error deleting file: {file_path}. Reason: {e}")

#Remove direcotry
os.rmdir(data_path)
Deleted file: ./jupyter_example/climate_change_land_use.png
Deleted file: ./jupyter_example/Livestock_LCA.png